By Swati Gaur, Program Manager Monitoring, Evaluation, Research and Learning, Digital Green
Digital Green amplifies the effectiveness of existing public and private agricultural extension programs by engaging with and training the community on producing and sharing videos on local best practices. These videos are screened using battery-operated pico projectors by village facilitators who use the videos to spark interactive conversations among farmer groups, like women self-help groups, on a fortnightly basis. As these facilitators screen the videos, they also record data like farmers attendance, their feedback, and the practices that farmers apply on their own farms afterwards.
Digital Green uses a selection of indicators to measure performance, like the number of videos produced, number of videos screened, number of farmers reached, and number of farmers that apply (or adopt) promoted practices on their farms. All of this data is tracked on an online-offline open-source MIS that we’ve developed, called COCO (digitalgreen.org/tech). The data captured in this MIS allows us to see where farmers are attending screenings regularly and adopting practices en masse or not.
Internally, we sometimes believe that our work has the same positive impact everywhere and that we are confronted by the same negative externalities everywhere. We found though that there sometimes were significant differences in farmers adoption-to-attendance ratio from one village to another, even if they were in close proximity to each other.We struggled to reason why that might be the case.
Health development initiatives sometimes employ a bottleneck analysis process to improve program quality by mapping an interventions theory of change and seeing what challenges might be limiting the impact that it is making. In collaboration with ALINe (https://www.aline.org.uk/), we decided to see how we could adapt that approach for our work with the Government of India’s National Rural Livelihood Mission (NRLM) in Bihar.
We decided to execute the bottleneck analysis in two districts. First, we went to two poor performing villages in two districts where our data suggested that farmers had adopted few to no adoptions of the promoted practices. Then, we went to two additional villages in the same districts where farmers seemed to be adopting the same promoted practices at a higher rate. A qualitative as well as quantitative determination was made on how representative these villages were over the ~1,500 villages that we work with in Bihar. Our aim was to identify the drivers that led to negative outcomes and those that led to positive ones in each set of villages to be able to develop concrete recommendations on ways to improve program quality and ultimately, impact.
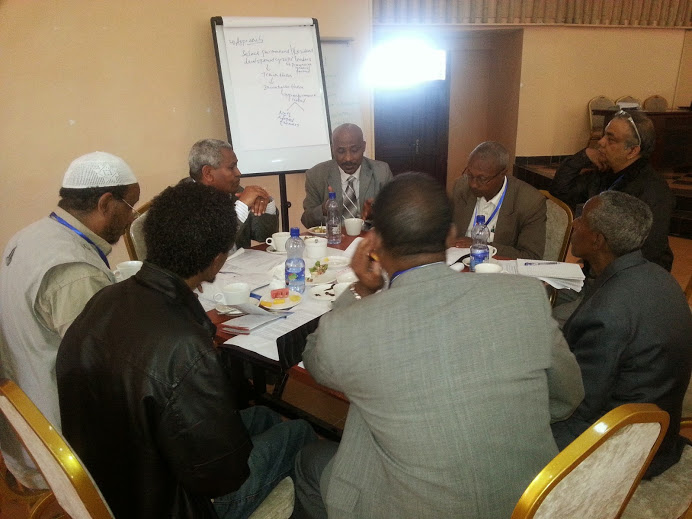
The bottleneck analysis process involved project participants at various levels: (1) farmers in self-help groups that attended video screenings, (2) village facilitators who mediated video screenings, (3) village organizations, and (4) NRLMs staff at district and block-levels. First, each group was anonymously requested, through ballot boxes, to share the issues that they face. Then, each group prioritized them. And finally, they developed their own recommendations on how to resolve them. With each group of stakeholders, the recommendations of the stakeholders before them would be shared and rated as well. A good deal of investigation and triangulation was sometimes needed to make sense of multiple perspectives.
We mapped the actions (and interactions) that each actor in the Digital Green approach needs to make to be able to realize the outcomes that we collectively expect. We found that these conversations themselves built ownership and common understanding of issues and mechanisms to address them. Stakeholders were able to understand how an issue that was identified in one location may have been resolved through a good practice applied in another location. By identifying the factors that drove performance in video screenings and farmer adoption of promoted practices, we were able to categorize both issues and good practices in four dimensions: context (e.g., landholding, irrigation access, irrigation), people (e.g., village facilitator skills and motivation), equipment (e.g., pico projector reliability), and system (e.g., policies for incentivizing facilitators, relevance of videos, involvement of NRLM staff).
The insights from the bottleneck analysis have allowed us to see the adaptation and impact of our approach in more nuanced terms on a per village basis. Moreover, we’ve been able to make concrete insights and recommendations to improve program quality based on the way that our approach is unfolding across the diversity of villages in which we work.The process of conducting the bottleneck analysis is intensive, but our field implementation teams now see it as a way to not just diagnose and resolve issues, but also to better plan our operational rollout more systematically.
For more details on the process and findings of the preliminary bottleneck analysis that we conducted, please see the following slide deck: https://drive.google.com/file/d/0BwQ6n7LySPA-LURpdFNvTzV2blk/view?usp=sharing
We would appreciate any comments or suggestions on how we might be able to improve this approach and others experience in running similar sorts of program improvement processes.


 Some of the participants were excited just to “see a motion picture on the wall. Others appreciating the importance of the medium of film, say that farmer can easily adopt new technologies with this intervention. Some couldn’t resist saying Digital Green’s learning methodology is creative and thought provoking”, to our delight.

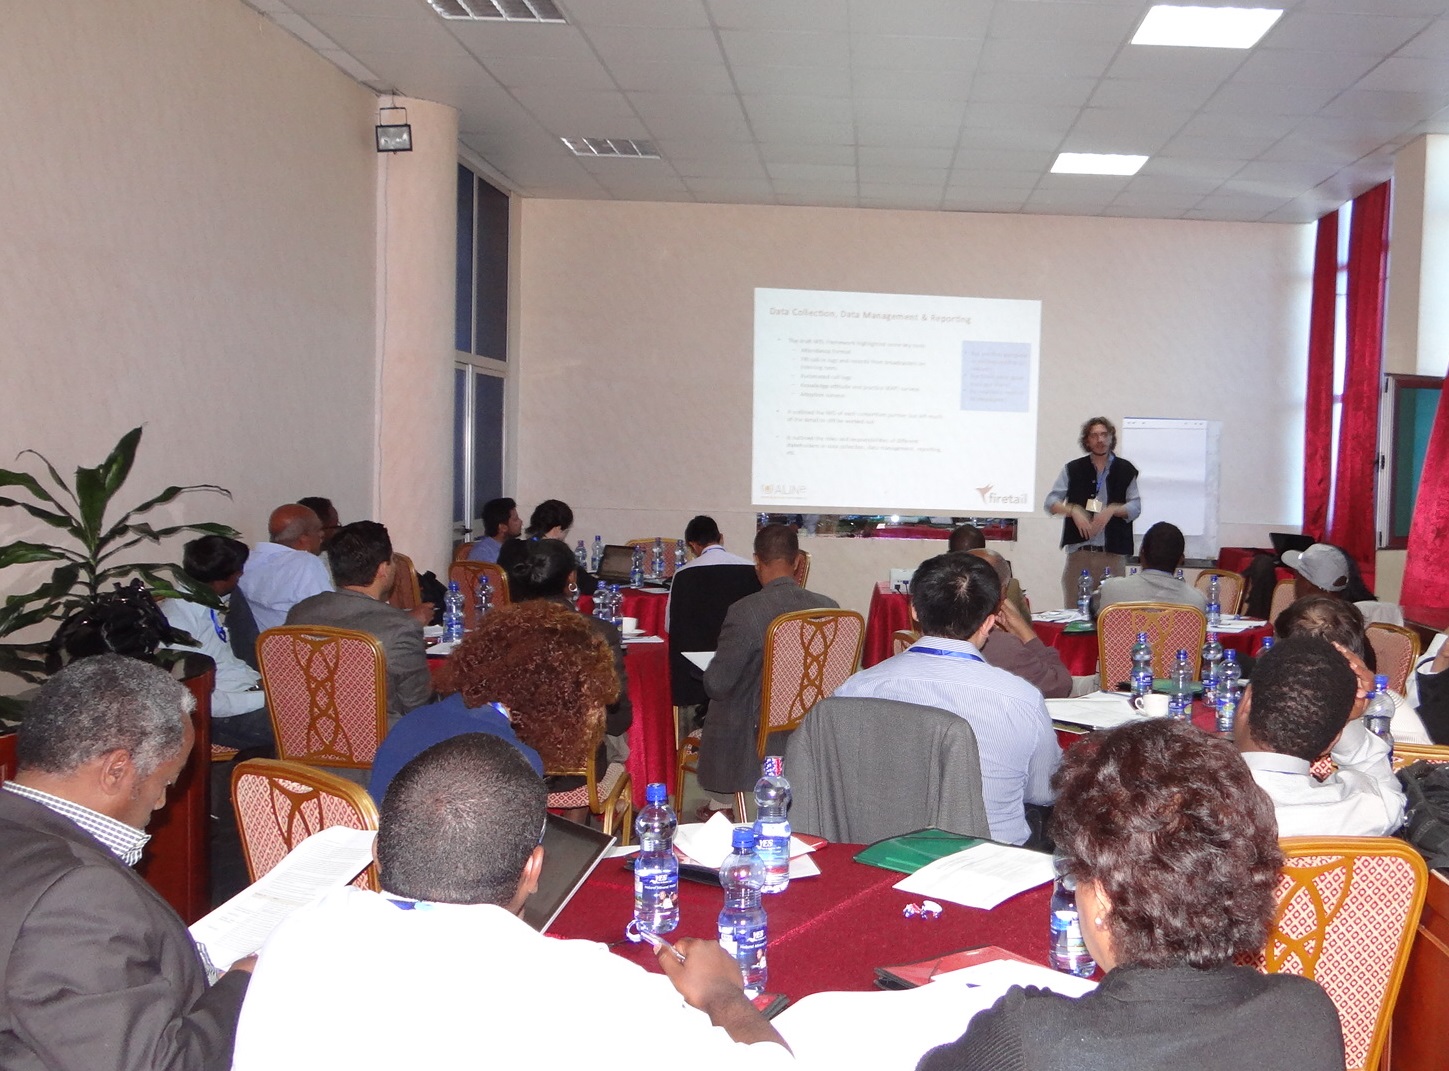
 Vinay Kumar, Chief Operating Officer, Digital Green, welcomed all the partners and outlined the objectives of the high-level convening. Ato Tesfaye, Director General of Agriculture Extension, welcomed MoA’s partnership with Digital Green and set the context for the need to institutionalize the Digital Green approach in the ministry various units and programs to ensure that it is fully internalized within Ethiopia agriculture extension system.
